Raman_MIP
|
In collaboration with Karsten Haupt and Ilana Bar |
|
Kantarovich, Belmont, Haupt, Bar, Gheber, Appl. Phys. Lett. 94(194103), 1-3, (2009). Kantarovich, Tsarfati, Gheber, Haupt, Bar, Anal. Chem. 81, 5686-5690, (2009). Kantarovich, Tsarfati, Gheber, Haupt, Bar, Biosens. Bioelectron. 26(2), 809-814, (2010). Bompart, Gheber, De Wilde, Haupt, Biosens. Bioelectron. 25(3), 568-571, (2009).
|
||||||||||||||||||||
|
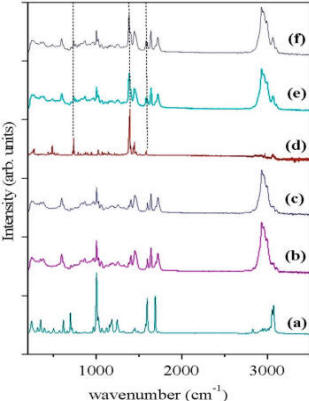
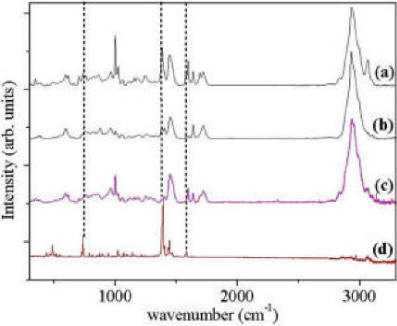
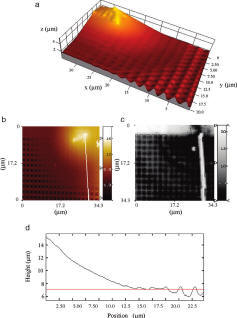
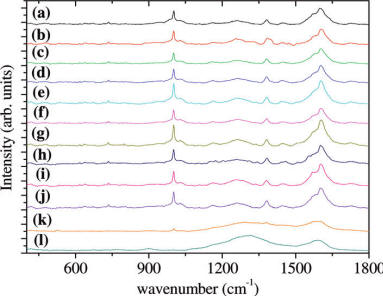
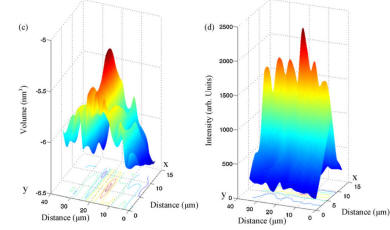
Label-free detection methods are important in (bio)sensing, since without them, "on-line" monitoring is not possible. Indeed label-free detection methods exist, most notably Surface Plasmon Resonance (SPR) and Quartz Crystal Microbalance (QCM). The problem with these methods is that they are not specific: they report on accumulation of material on the sensor surface. Raman spectroscopy provides chemical information about specific bonds, and is thus a very attractive method for specific label-free detection. To test the limits of sensitivity of this approach we monitored spots of MIP imprinted against propranolol, using a confocal Raman setup. We first characterized the spectrum of each component of the MIP, and confirmed that the target molecule (propranolol) has a distinct fingerprint. Using this fact, we were able to measure quantitatively the amount of bound propranolol. Moreover, we demonstrated the selectivity of the MIP, for the isoforms (S and R) of propranolol. |
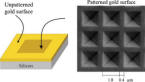
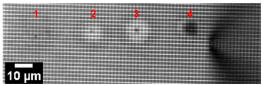
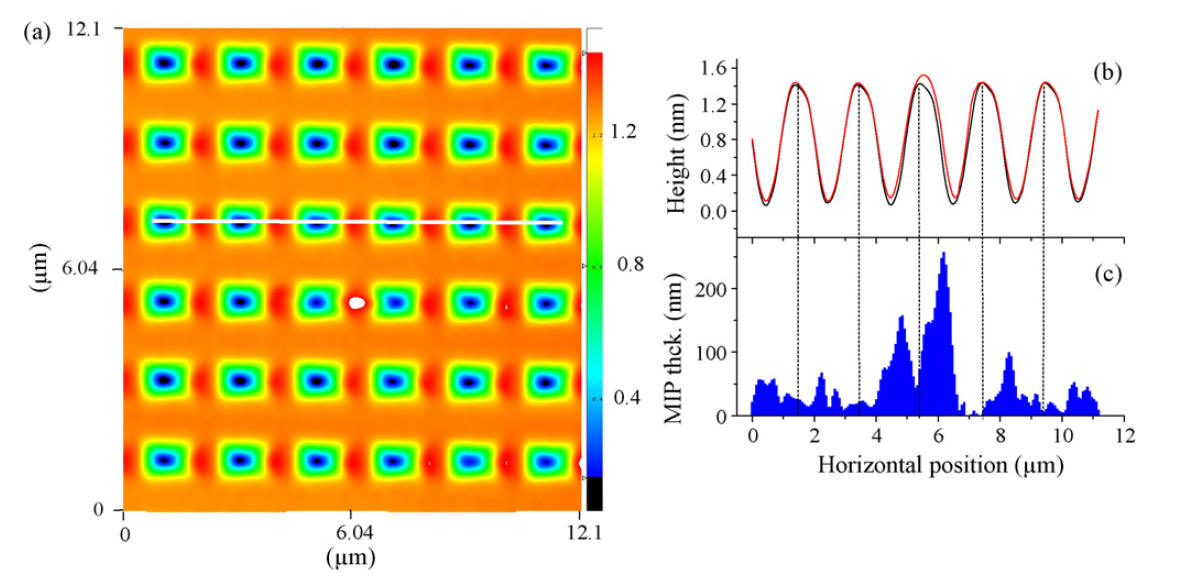
Surface Enhanced Raman Spectroscopy (SERS) makes use of the enhancement provided by metallic surfaces (usually Gold), especially in the vicinity of sharp features, to provide superior sensitivity. We used surfaces specially designed for SERS ("Klarite" now from Renishaw) and our NFP technique to deposit drops of MIP on these surfaces, and study the signal enhancement.
|
|||||||||||||||||||
|
|
|||||||||||||||||||
|
This page was last updated 31-Dec-12 |
||||||||||||||||||||
|
|
||||||||||||||||||||